What Is Sand and Dust Storm? | SPRINTARS for SDS Forecasting | SDS Forecast (Movie) | Monthly/Annual Deposition Amount of SDS | Related Links
What Is Sand and Dust Storm?
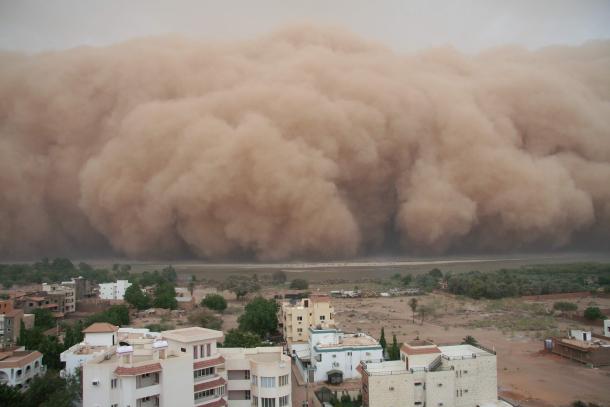
Photo by World Meteorological Organization
Basic Information
Sand and dust storm (SDS) is a common meteorological hazard in arid and semi-arid regions. It is usually caused by thunderstorms – or strong pressure gradients associated with cyclones – which increase wind speed over a wide area. The strong winds lift large amounts of sand and dust from bare, dry soils into the atmosphere, transporting them hundreds to thousands of kilometres away.
About 40% of aerosols in the troposphere (the lowest layer of Earth’s atmosphere) comprised of dust particles from wind erosion. The main sources of these mineral dusts are the arid regions of Northern Africa, the Arabian Peninsula, Central Asia and China. Comparatively, Australia, America and South Africa make minor, but still significant, contributions to the dust particles in the troposphere. Global estimates of dust emissions, mainly derived from simulation models, vary between 1 to 3 giga tons per year.
Once released from the surface, dust particles are raised to higher levels in the troposphere by turbulent mixing and convective updrafts. They can then be transported by winds for lengths of time, depending on their size and meteorological conditions, before being pulled back down to the surface again. As larger particles sediment more quickly than smaller ones, there is a shift toward smaller particle sizes during transport. Dust is also washed out from the atmosphere by precipitation. The average lifetime of dust particles in the atmosphere ranges from a few hours for particles with a diameter larger than 10 μm, to more than 10 days for the finer or submicrometric ones.
Impacts on Human Health
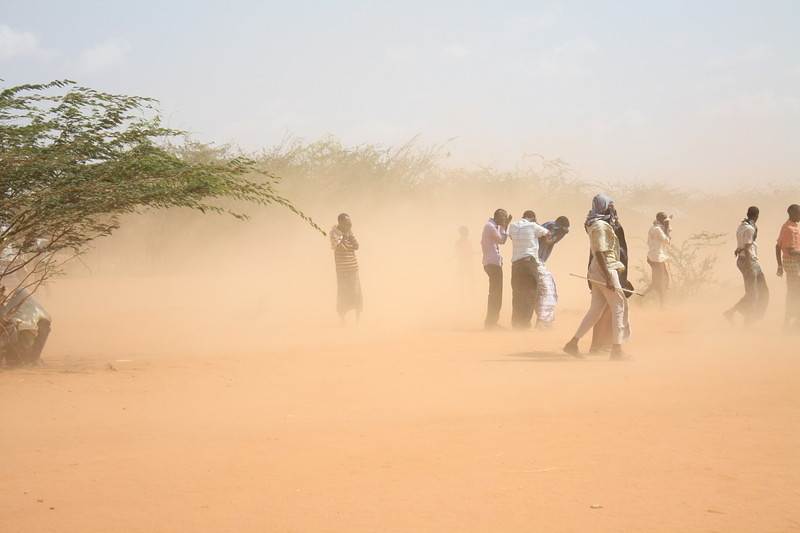
Photo by Jo Harrison/ Oxfam
Airborne dust presents serious risk to human health, and the dust particle size is the key determinant of potential hazard. Particles larger than 10 μm are not breathable, thus can only damage external organs, mostly causing skin and eye irritations, conjunctivitis and enhanced susceptibility to ocular infection. Inhalable particles, or those smaller than 10 μm, often get trapped in the nose, mouth and upper respiratory tract, hence can be associated with respiratory disorders such as asthma, tracheitis, pneumonia, allergic rhinitis and silicosis. However, finer particles may penetrate the lower respiratory tract and enter the bloodstream, where they can affect all internal organs and be responsible for cardiovascular disorders. A global model assessment in 2014 estimated that exposure to dust particles caused about 400,000 premature deaths by cardiopulmonary disease in the over 30 population.
Some infectious diseases can be transmitted by dust. Meningococcal meningitis, a bacterial infection of the thin tissue layer that surrounds the brain and spinal cord, can result in brain damage and, if untreated, death in 50% of cases. Outbreaks occur worldwide, yet the highest incidence is found in the “meningitis belt”, a part of sub-Saharan Africa with an estimated population of 300 million. These outbreaks have a strong seasonal pattern and many studies have linked environmental conditions, such as low humidity and dusty conditions, to the time and place of infections. Researchers believe that the inhalation of dust particles in hot dry weather may damage nose and throat mucosa, creating favourable conditions for bacterial infection. Moreover, iron oxides embedded in dust particles may enhance the risk of infection.
(Source: World Meteorological Organization)
SPRINTARS for SDS Forecasting
SPRINTARS※ (Spectral Radiation Transport Model for Aerosol Species) is a numerical model established for simulating effects of atmospheric aerosols on the climate system and condition of atmospheric pollution on the global scale.
SPRINTARS has been primarily developed by the Climate Change Science Section of the Research Institute for Applied Mechanics in Kyushu University. It treats main tropospheric aerosols both from natural and anthropogenic sources (black carbon, organic matter, sulfate, soil dust and sea salt). It is categorised into SPM, PM10 and PM2.5. SPRINTARS calculates transport processes of aerosols (emission, advection, diffusion, wet deposition, dry deposition and gravitational settling). The aerosol-radiation interaction (which is the scattering and absorption of solar and thermal radiation by aerosols) and the aerosol-cloud interaction (the act of aerosols as cloud condensation nuclei and ice nuclei) are included in the calculation. SPRINTARS is based on an atmosphere-ocean general circulation model, MIROC, developed by the Atmosphere and Ocean Research Institute (Division of Climate System Research), University of Tokyo, National Institute for Environmental Studies, and Japan Agency for Marine-Earth Science and Technology, and it is also incorporated into a global cloud resolving model, NICAM.
(Source: SPRINTARS developer team)
※Note:The website of SPRINTARS provides information on trial basis to spread the research outcome achieved by the developer team and get feedback and recommendation to improve the accuracy of the simulation. As it is not for commercial purpose, SPRINTARS developer team will not be responsible for any event that may happen from the use of information on said website.
SDS Forecast (Movie)
(Source: SPRINTARS developer team)
The video above is the soil dust forecast in North Africa based on the simulation with SPRINTARS. It was made by expected mean mass concentration of soil dust from the near-surface to about 200 m, and its horizontal resolution is about 35 km.
It indicates areas where the mean mass concentration of soil dust will be above 150 μg/m3 , exceeding the limits set by WHO.
WHO Air Quality Guidelines (AQG) offers guidance on threshold limits for key air pollutants that pose health risks, and provide a reference for setting air pollution targets at regional and national levels to improve air quality. The guidelines provide recommended exposure levels for particulate matter (PM10 and PM2.5) and a set of interim targets to encourage a progressive improvement in air quality.
According to the Guidelines, a PM10 concentration of 150 µg/m3 is expected to translate into roughly 5% increase in daily mortality, an impact that could be of significant concern, and one for which immediate mitigation actions should be recommended.
WHO air quality guidelines and interim targets for particulate matter: 24-hour concentrations
| PM10 (μg/m3) | PM2.5 (μg/m3) | PM10 (μg/m3) PM2.5 (μg/m3) Basis for the Selected Level | |
|---|---|---|---|
| Interim target-1 (IT-1) |
150 | 75 | Based on published risk coefficients from multi-centre studies and meta-analyses (about 5% increase of short-term mortality over the AQG value) |
| Interim target-2 (IT-2) |
100 | 50 | Based on published risk coefficients from multi-centre studies and meta-analyses (about 2.5% increase of short-term mortality over the AQG value) |
| Interim target-2 (IT-2) |
75 | 37.5 | Interim target-3 (IT-3) 75 37.5 Based on published risk coefficients from multi-centre studies and meta-analyses (about 1.2% increase of short-term mortality over the AQG value) |
| Air quality guideline (AQG) | 50 | 25 | Based on the relationship between 24 h and annual PM levels |
a 99th percentile (3 days/year).
* For management purposes. Based on annual average guideline values; precise number to be determined on basis of local frequency distribution of daily means. The frequency distribution of daily PM2.5 or PM10 values usually approximates to a log-normal distribution.
By using SPRINTARS, it may be possible to establish an effective monitoring and early-warning system for SDS at regional, national and community levels and also identify measures to tackle sand dust generation in hotspot zones which needs prioritise prevention interventions on the ground.
Monthly/Annual Deposition Amount of SDS
The pictures below show monthly and annual amounts of particulate matter deposited in North Africa. These information can be utilised to make construction and maintenance plans of infrastructures, logistic plans for cargo, and national or regional development masterplans.
Monthly particle matter deposition in June 2019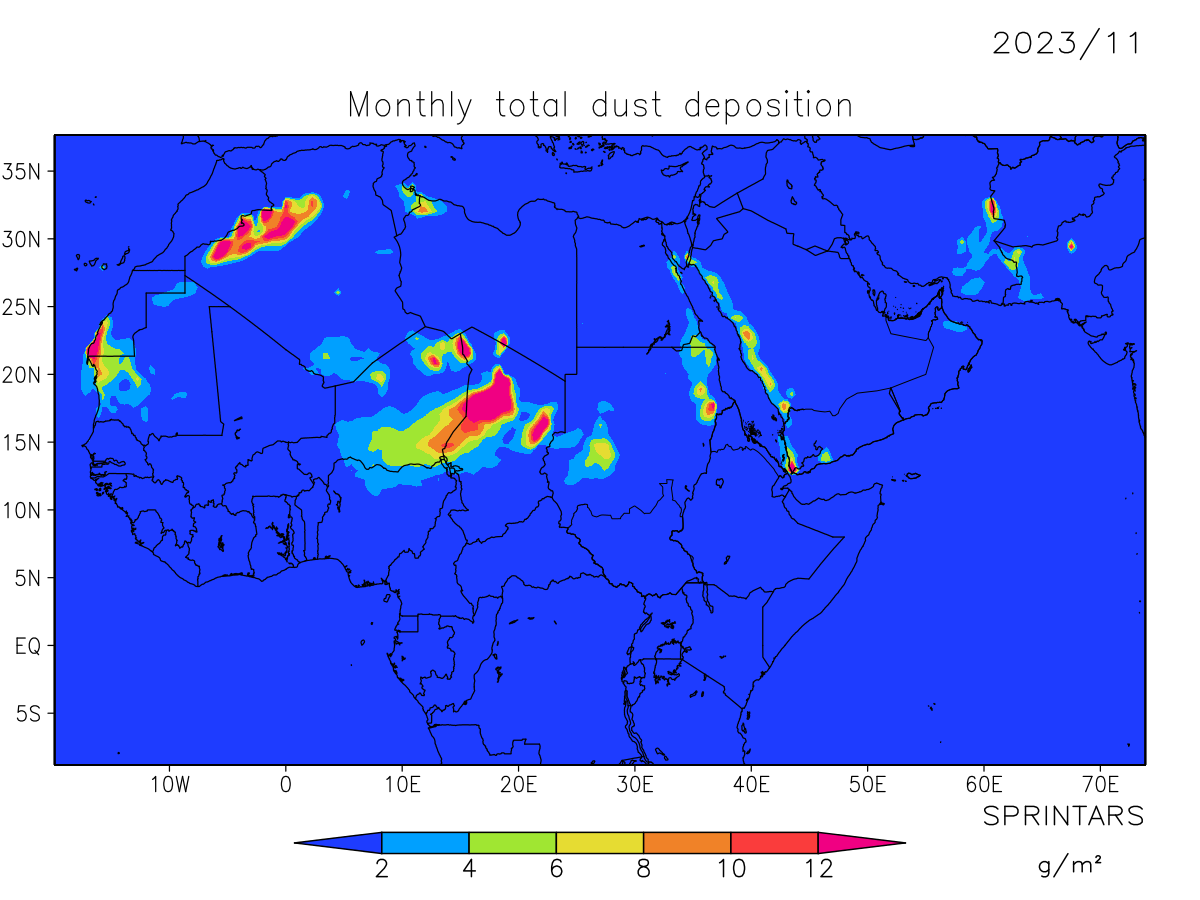 |
Annual particle matter deposition in 2018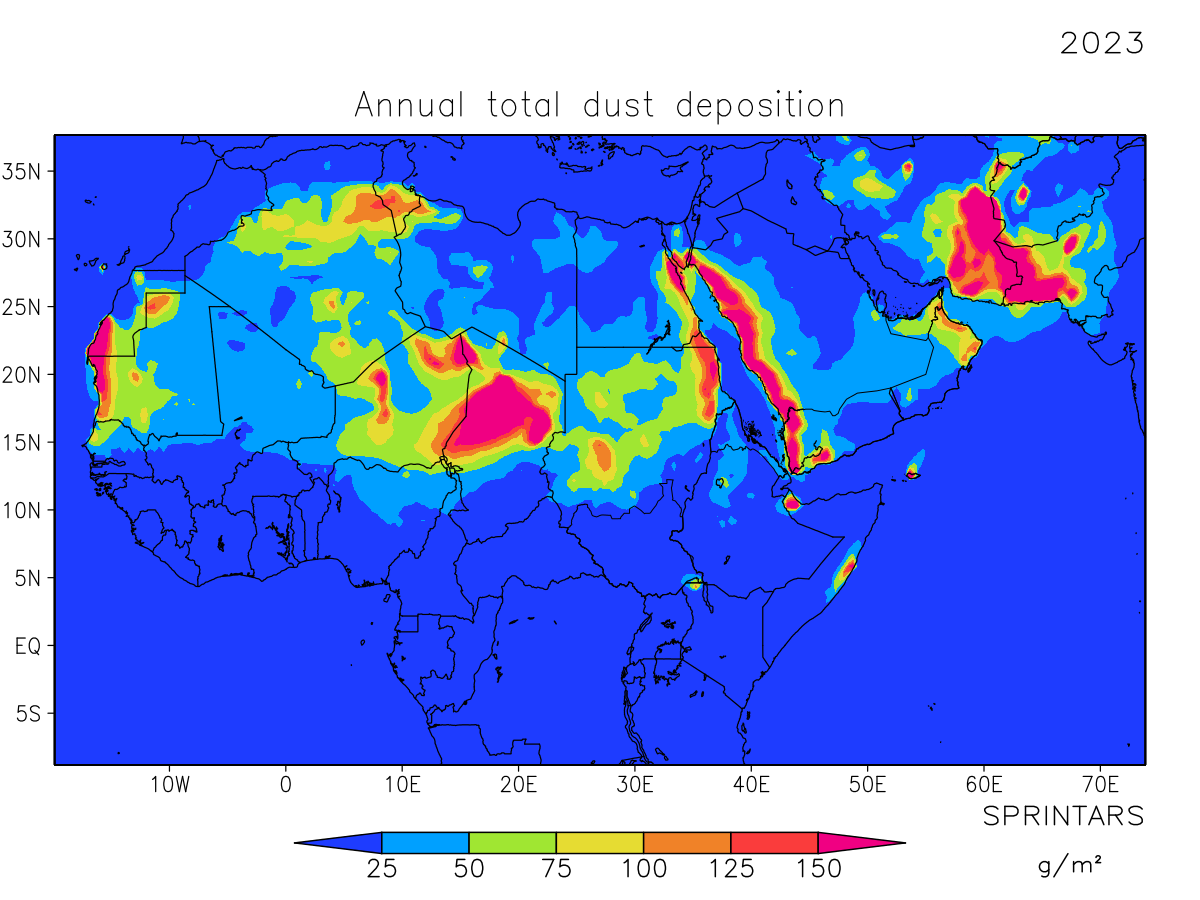 |
The pictures of other months and years are available below.
- Monthly particle matter deposition since January 2012
Select a year and month of which you want to get a data
- Annual particle matter deposition since 2012
Select a year of which you want to get a data
Related Links
World Health Organization (WHO), Air pollution: https://www.who.int/airpollution/en/
・UNCCD Sand Dust and Storms:https://www.unccd.int/actions/sand-and-dust-storms
・WMO Sand and Dust Storm:https://public.wmo.int/en/our-mandate/focus-areas/environment/SDS
・SPRINTARS:https://sprintars.riam.kyushu-u.ac.jp/indexe.html